Demystifying Open Interest in Bitcoin Futures Markets
A lot of traders are confused about Open Interest on bitcoin derivatives: what it represents and what impact, if any, it could have on the market.
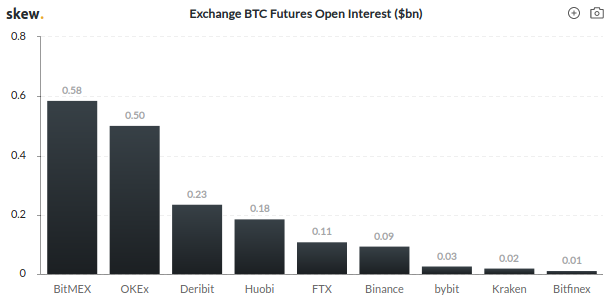 Current overview of Open Interest in BTC:USD Futures (from Skew.com 15 Mar 2020)
The formula for Open Interest is remarkably simple, and there are two key concepts I will highlight in this article:
-
Open Interest always consists of 50% net long positions and 50% net short positions — the “Long/Short” ratio of the entire market is therefore always 50/50.
-
Open Interest = (Net Open Long Positions + Net Open Short Positions)/ 2
Note that there is no direct relationship between all volume and Open Interest.
Anyone who has studied economics in university, especially on the graduate level, gets beat into their head about the difference between “stock” and “flow” measures in economic systems/markets. “Stock” values are measures given at a point in time. “Flow” values are measures given over a period of time.
For example, the book value of a company (stock) versus its net income (flow). Or the market capitalisation (stock) of a company versus the traded share volume in the market (flow). And in this case: Open Interest (stock) versus the traded volume (flow).
Every Trade Has Both a Buyer and Seller!
First, it is important to point out that, in addition to the above mentioned concept that OI represents equal number of long and short, that every single execution in the market represents an equal volume of buy and sell.
This is true not only in counterparty derivatives markets but also on spot markets. You simply can not have an executed buyer without an equal seller at a given price and quantity, likewise you can’t have a seller in the market get filled without an equal buyer doing the filling.
This may seem like a really obvious concept now but people are often very confused about how and why market prices move and will often say in a rising market that “there are more buyers than sellers” to explain the upward price move.
The more correct way to describe the situation is that “the market-clearing price for which there is an equal number of buyers and sellers is falling.” As long as there are trades executing in the market, if price is moving, then there is an equal number of buyers and sellers getting executed and you can define the falling price as the “market clearing” price.
What Influences Open Interest? Alice, Bob, & Charlie Trade Futures
Now, back to OI — aka the current open positions in the market — what causes it to move, or not move?
Before I lay it out let’s think of a very basic situation where a market has just launched and OI is just zero. Buyers and sellers place limit orders in the book to open positions and none of them have open positions yet.
In order for OI to go up from here you need two counterparties — one long and one short — both expanding their net open position. So if Bitcoin is trading at $5,400 and a buyer (Alice) and seller (Bob) meet in the book there for 1 BTC, OI will go up to 1 BTC and there will be 1 BTC worth of a net short position (Bob’s) and 1 BTC worth of a net long (Alice’s). The net impact from this trade is that Open Interest increases from 0 BTC to 1 BTC.
Now what happens if price goes to $5,500 and a new buyer, Charlie, wants to go long? Let’s assume Alice, who is scalping, has a sell order for her 1 BTC position at $5,500, i.e., she wants to close out her little scalp long. Say Charlie, who has no position, shorts 1 BTC into Alice’s bid. Alice has passed along her 1 BTC long over to Charlie, who is now 1 BTC long vs. Bob’s 1 BTC short. In this case, the trade represents one party closing their net position and one party expanding their net open position. The net impact from this trade is that Open Interest is flat at 1 BTC.
Finally, let’s assume price moves to $5,700 and OI is still 1 BTC. Now Bob is panicking and wants to close out of his 1 BTC short from $5,400. Meanwhile, Charlie is up $200 and wants to close out his 1 BTC long from $5,500. Bob puts a limit buy to close his short at $5,700 and Charlie sees it and sells his 1 BTC long into it. In this execution, both Bob and Charlie are closing out their net positions. The net impact from this trade is that Open Interest falls -1 BTC and the market now has no open positions.
OI Formula
In summation of the above example there are three types of trades to keep in mind for OI considerations:
-
If both buy and sell side of the trade are expanding their net open positions, then Open Interest increases by the volume on the trade.
-
If both buy and sell side of the trade are closing/contracting their net open positions, then Open Interest decreases by the volume on the trade.
-
If one side (either buy or sell) is expanding their net open position and the other side (either buy or sell) is contracting their net open position, then the Open Interest stays flat at the same amount it was before.
This shows how simple the concept of Open Interest is and how the market activity can generate changes in the figure.
How does OI relate to magnitude of trading volume?
As described above, volume and OI are not intricately linked, but you can derive OI from historical volume if you know the sides that are opening and closing net open positions.
Given this, we can observe both a ratio of Volume to OI that is very high (especially in high leverage markets with scalpers that jump in and out of position and don’t have a big impact on OI), or you can have a ratio that is very low where traders are not doing a lot of turnover relative to the open positions.
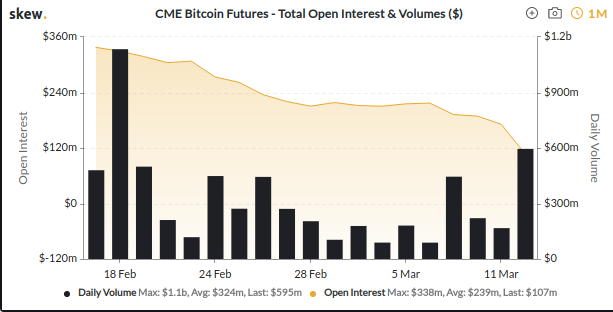 CME OI vs volume for past month. Source: Skew.com
The chart above of CME’s market volume and OI for the past month illustrates that there is no clear relationship between the two variables in the medium and long-run.
How does OI impact market price?
OI and market price also do not have a clear relationship to one another. However, there are cases where there can be a feedback loop between sharp market price changes and the magnitude of OI and subsequent changes in OI.
To illustrate the potential impact that OI can have on market price let’s use the recent price action this week, particularly on March 13, 2020, on BitMEX:
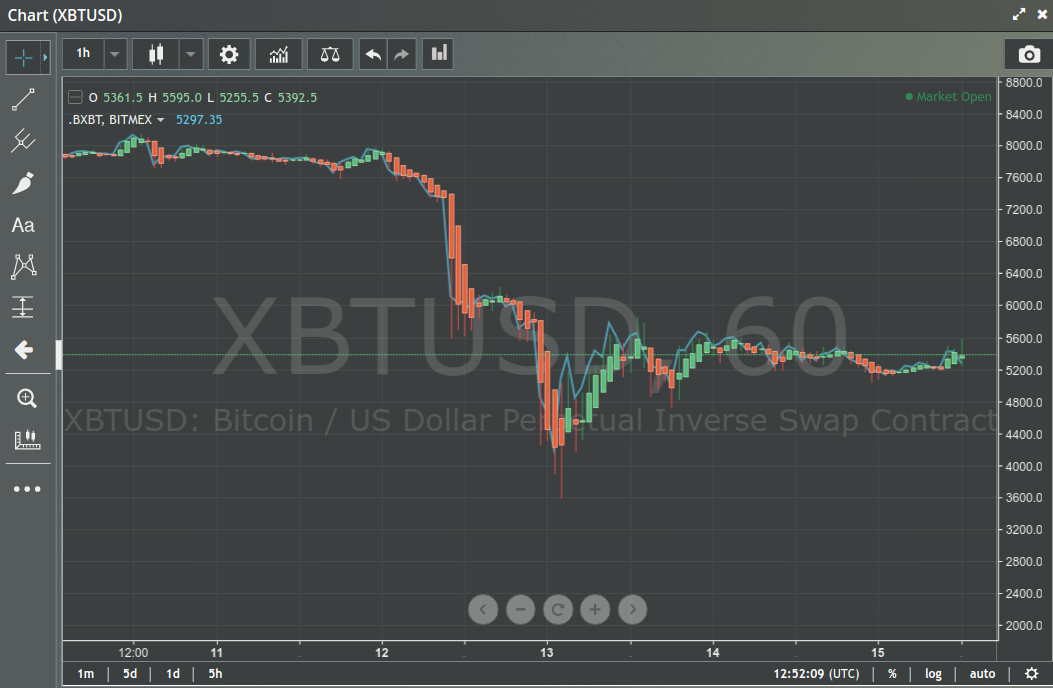 Price on XBTUSD perpetual contract on BitMEX. Source: BitMEX.com
Above you can see how wild the market was this week. Price tanked from 8K to 6K, and only waited a few hours before it made a final stab down to $3,600.
At the same time of this massive drop we can see that OI on BitMEX dropped by over 50%:
](https://cdn-images-1.medium.com/max/4200/0*90aZQFqZQchQlyF-)
This is an incredibly steep drop and historically significant especially in USD terms due to the price decline that coincided.
Careful though: this does not mean that because price dropped 50% that OI will drop 50%. In fact, there normally is not such a tight correlation.
However in this case there was an interesting phenomenon that occurred that is a result of not just the magnitude in the price drop but also the speed with which it occurred.
We know from BitMEX statistics published to their Blog that Longs tend to have 20–25x as the weighted average effective leverage:
](https://cdn-images-1.medium.com/max/2048/0*KF9a_zJ2ViJMuDCw.png) Source: BitMEX blog: https://blog.bitmex.com/bitmex-leverage-statistics-april-2019/
Source: BitMEX blog: https://blog.bitmex.com/bitmex-leverage-statistics-april-2019/
Now let’s look at the price action vs OI on the move this week:
 & Datamesh](https://cdn-images-1.medium.com/max/2000/0*zlPP3GGxPbrSijuS)
Note that the sharp drop in OI coincides with underlying price volatility.
The way that BitMEX handles unfilled liquidations in the market is that the system assumes the position of the bankrupt trader and then attempts to unload them into the market in an orderly fashion to balance things out.
You can imagine from a drop of $8,000 to $6,000, followed quickly by a drop below $4,000 — with average effective leverage of about 20x — this 25% drop followed by a 33% drop would liquidate a number of people. And with demand being impacted, this led to a lot of bankrupt counterparties being sold hard into the market against limited demand. This led to prices on BitMEX deviating from the underlying spot market as seen below in the price charted against Coinbase:
](https://cdn-images-1.medium.com/max/4200/0*MCLHpcwtEczu4HB_)
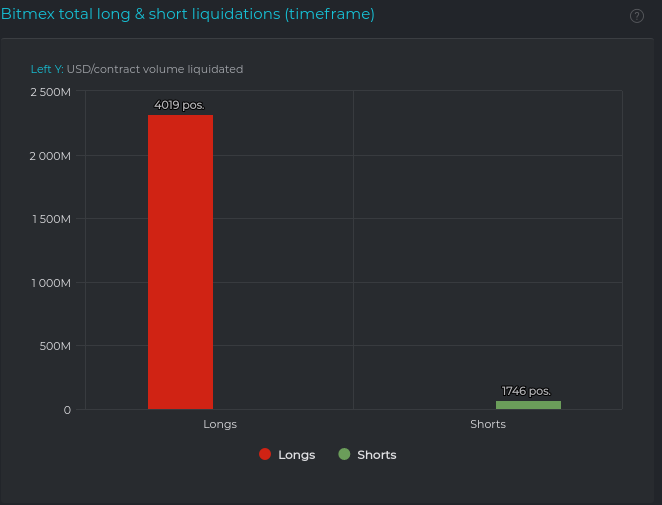
So what we had here was relatively large OI before a six-sigma drop in the market which led to OI cutting in half while traders on BitMEX together with the Liquidation engine unloaded $500M worth of OI into the market. However, isolating the liquidation volume over the entire week we can see that during this drop from $8,000 to $3,600, the forced selling into the market, BitMEX’s engine closing out bankrupt long positions, was closer to $2.5 BILLION:
This led to excessive pressure down in the futures market, which spilled over into the spot market — until the deviation became so extreme that the BitMEX (and thereafter, Deribit and FTX) traded at persistent discounts to the spot market due to this excess selling as a result of OI unloading on BitMEX. This dislocation is best expressed in the Perpetual funding rates on BitMEX and even Deribit (many marketmakers try to arbitrage dislocations on BitMEX using Deribit and vice versa):
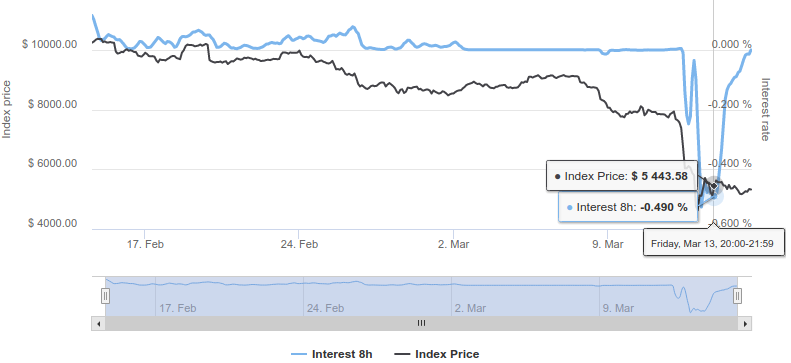 Historical funding rate on Deribit BTC:USD perpetual contract. Source: Deribit.com
Deribit’s max interest level is -0.5% versus BitMEX’s -0.375%. As seen above, the traded price on the contract was so far below the spot index that the rate was down near -0.5% for about two days. It took this time for buyers to come into the market and correct the dislocation.
The event this week then shows a clear case where OI can indeed have an impact on market price when there is significant volatility and the net open positions are forced to sell or get liquidated in a magnitude where it pushes prices aggressively in one direction.
Conclusion
Open Interest can be an elusive concept for many traders in bitcoin futures. However, upon examination it is rather simple: it merely represents the net open positions in the market and can change or remain flat depending on whether equal buy/sell market executions are opening, closing, or both.
Once it is understood you can find situations where OI and price can actually have a causal relationship. This is evidenced by price action this week where a massive drop in price led to many net longs closing their positions out either willingly or by force by an aggressive BitMEX liquidation algorithm, which led to further drops in market price in a viscous cycle.
Concept/creator: swapman - Head developer: instabot
Instabot is also founder at Alertatron, an alerting and trading automation service.